Start with a dataset
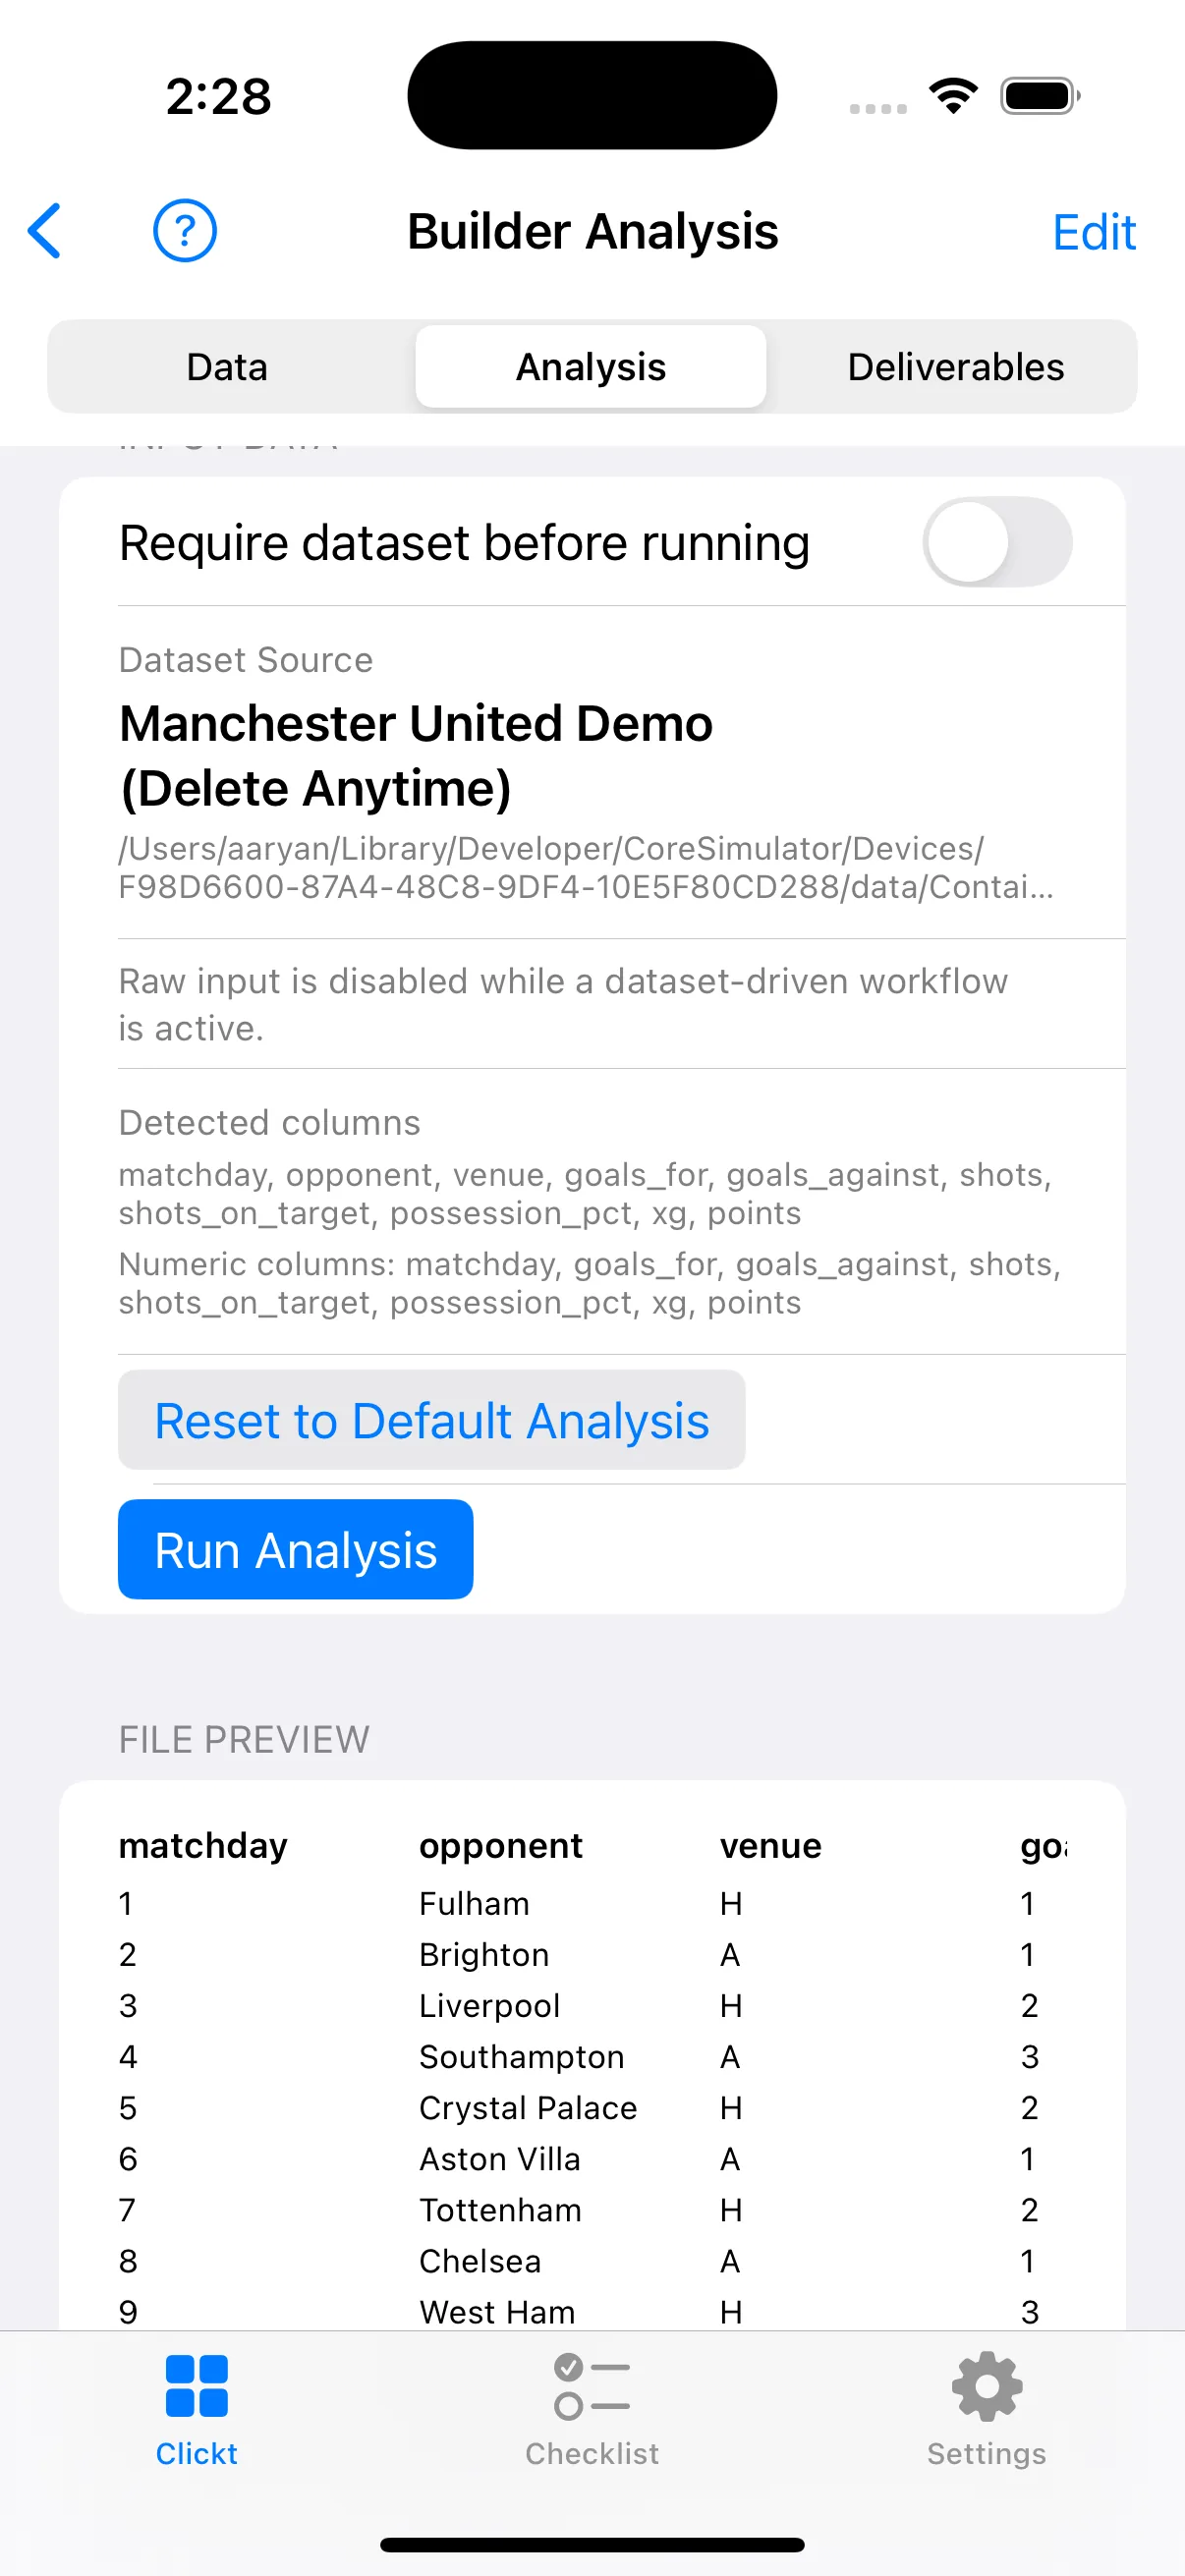
Import a CSV, TSV, plain-text, or JSON file, or register a dataset manually, then choose the one you want to analyse.
 Clickt
Builder
Builder helps you move from source data to analysis, a visual canvas, and an export or presentation handoff—without starting the story from scratch each time.
Released on Apple and Android platforms
What Builder does
Builder is made for work that needs a little more structure than a spreadsheet view, but still needs a deliverable that a person can inspect, edit, and share.
Import a CSV, TSV, plain-text, or JSON file, or register a dataset manually, then choose the one you want to analyse.
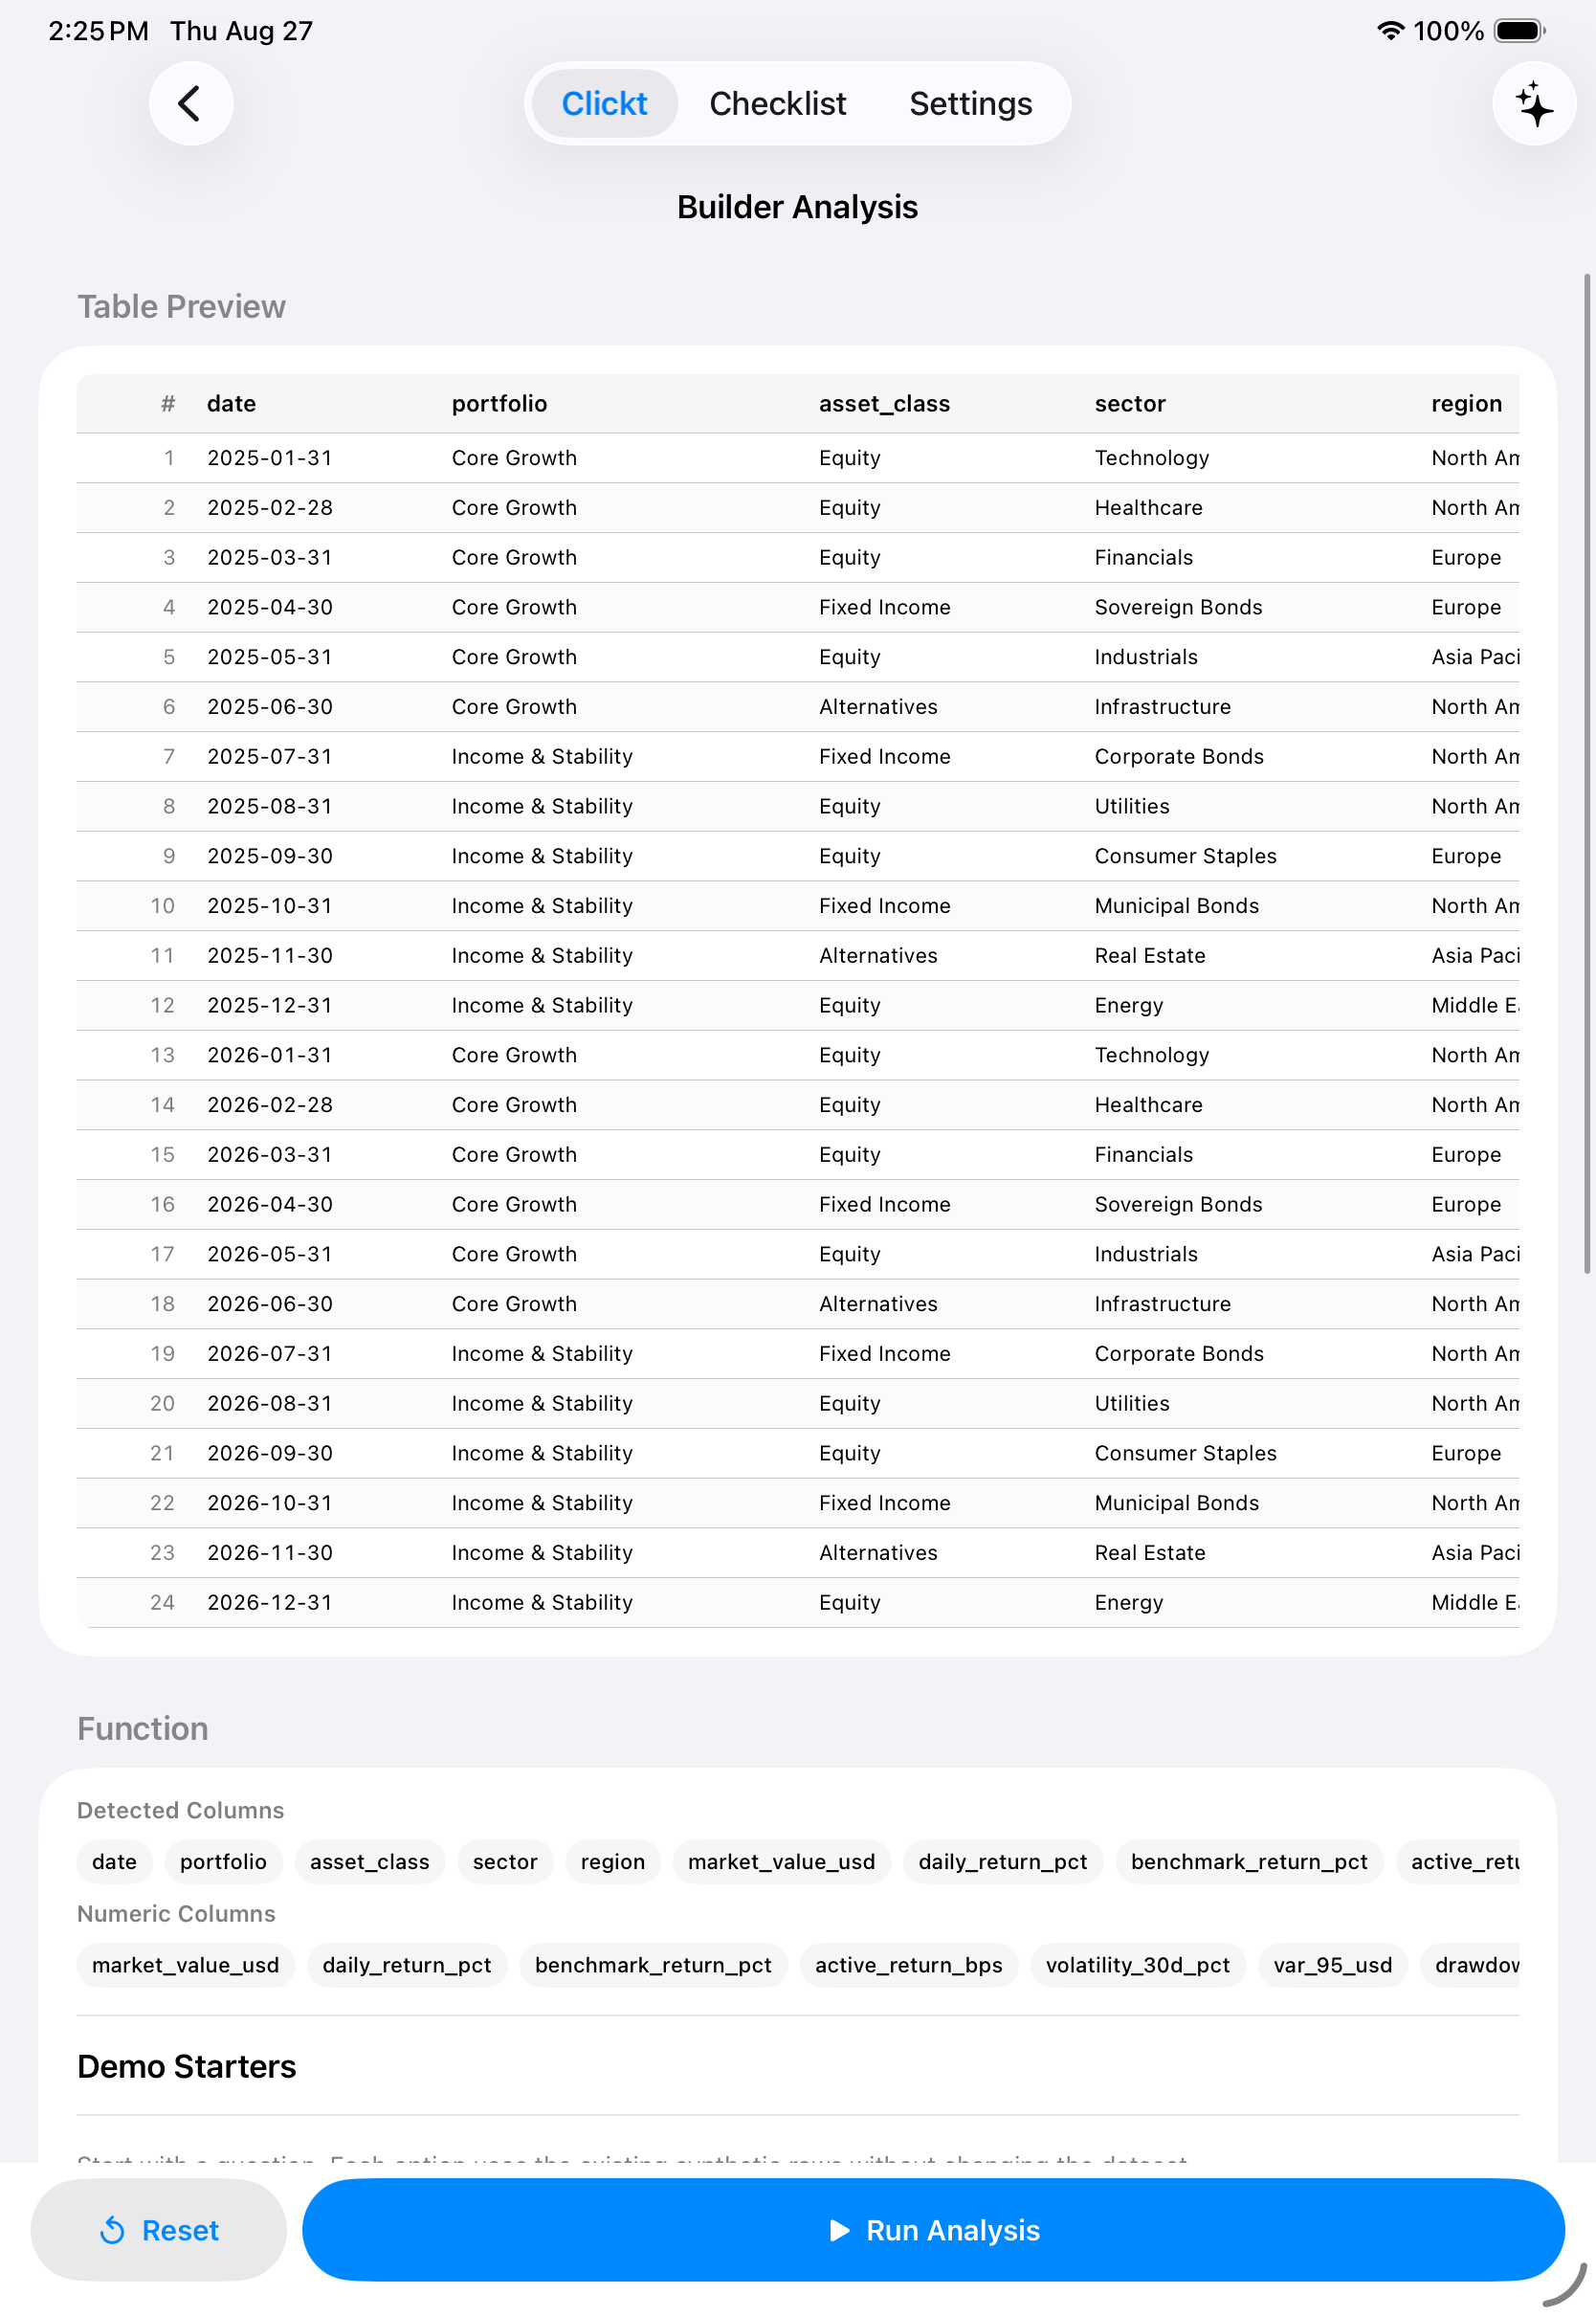
Work through dataset columns and analysis steps, then choose from 12 chart types—bar, line, scatter, area, histogram, box plot, heatmap, pie, donut, and more—to make the signal in the data easier to inspect.
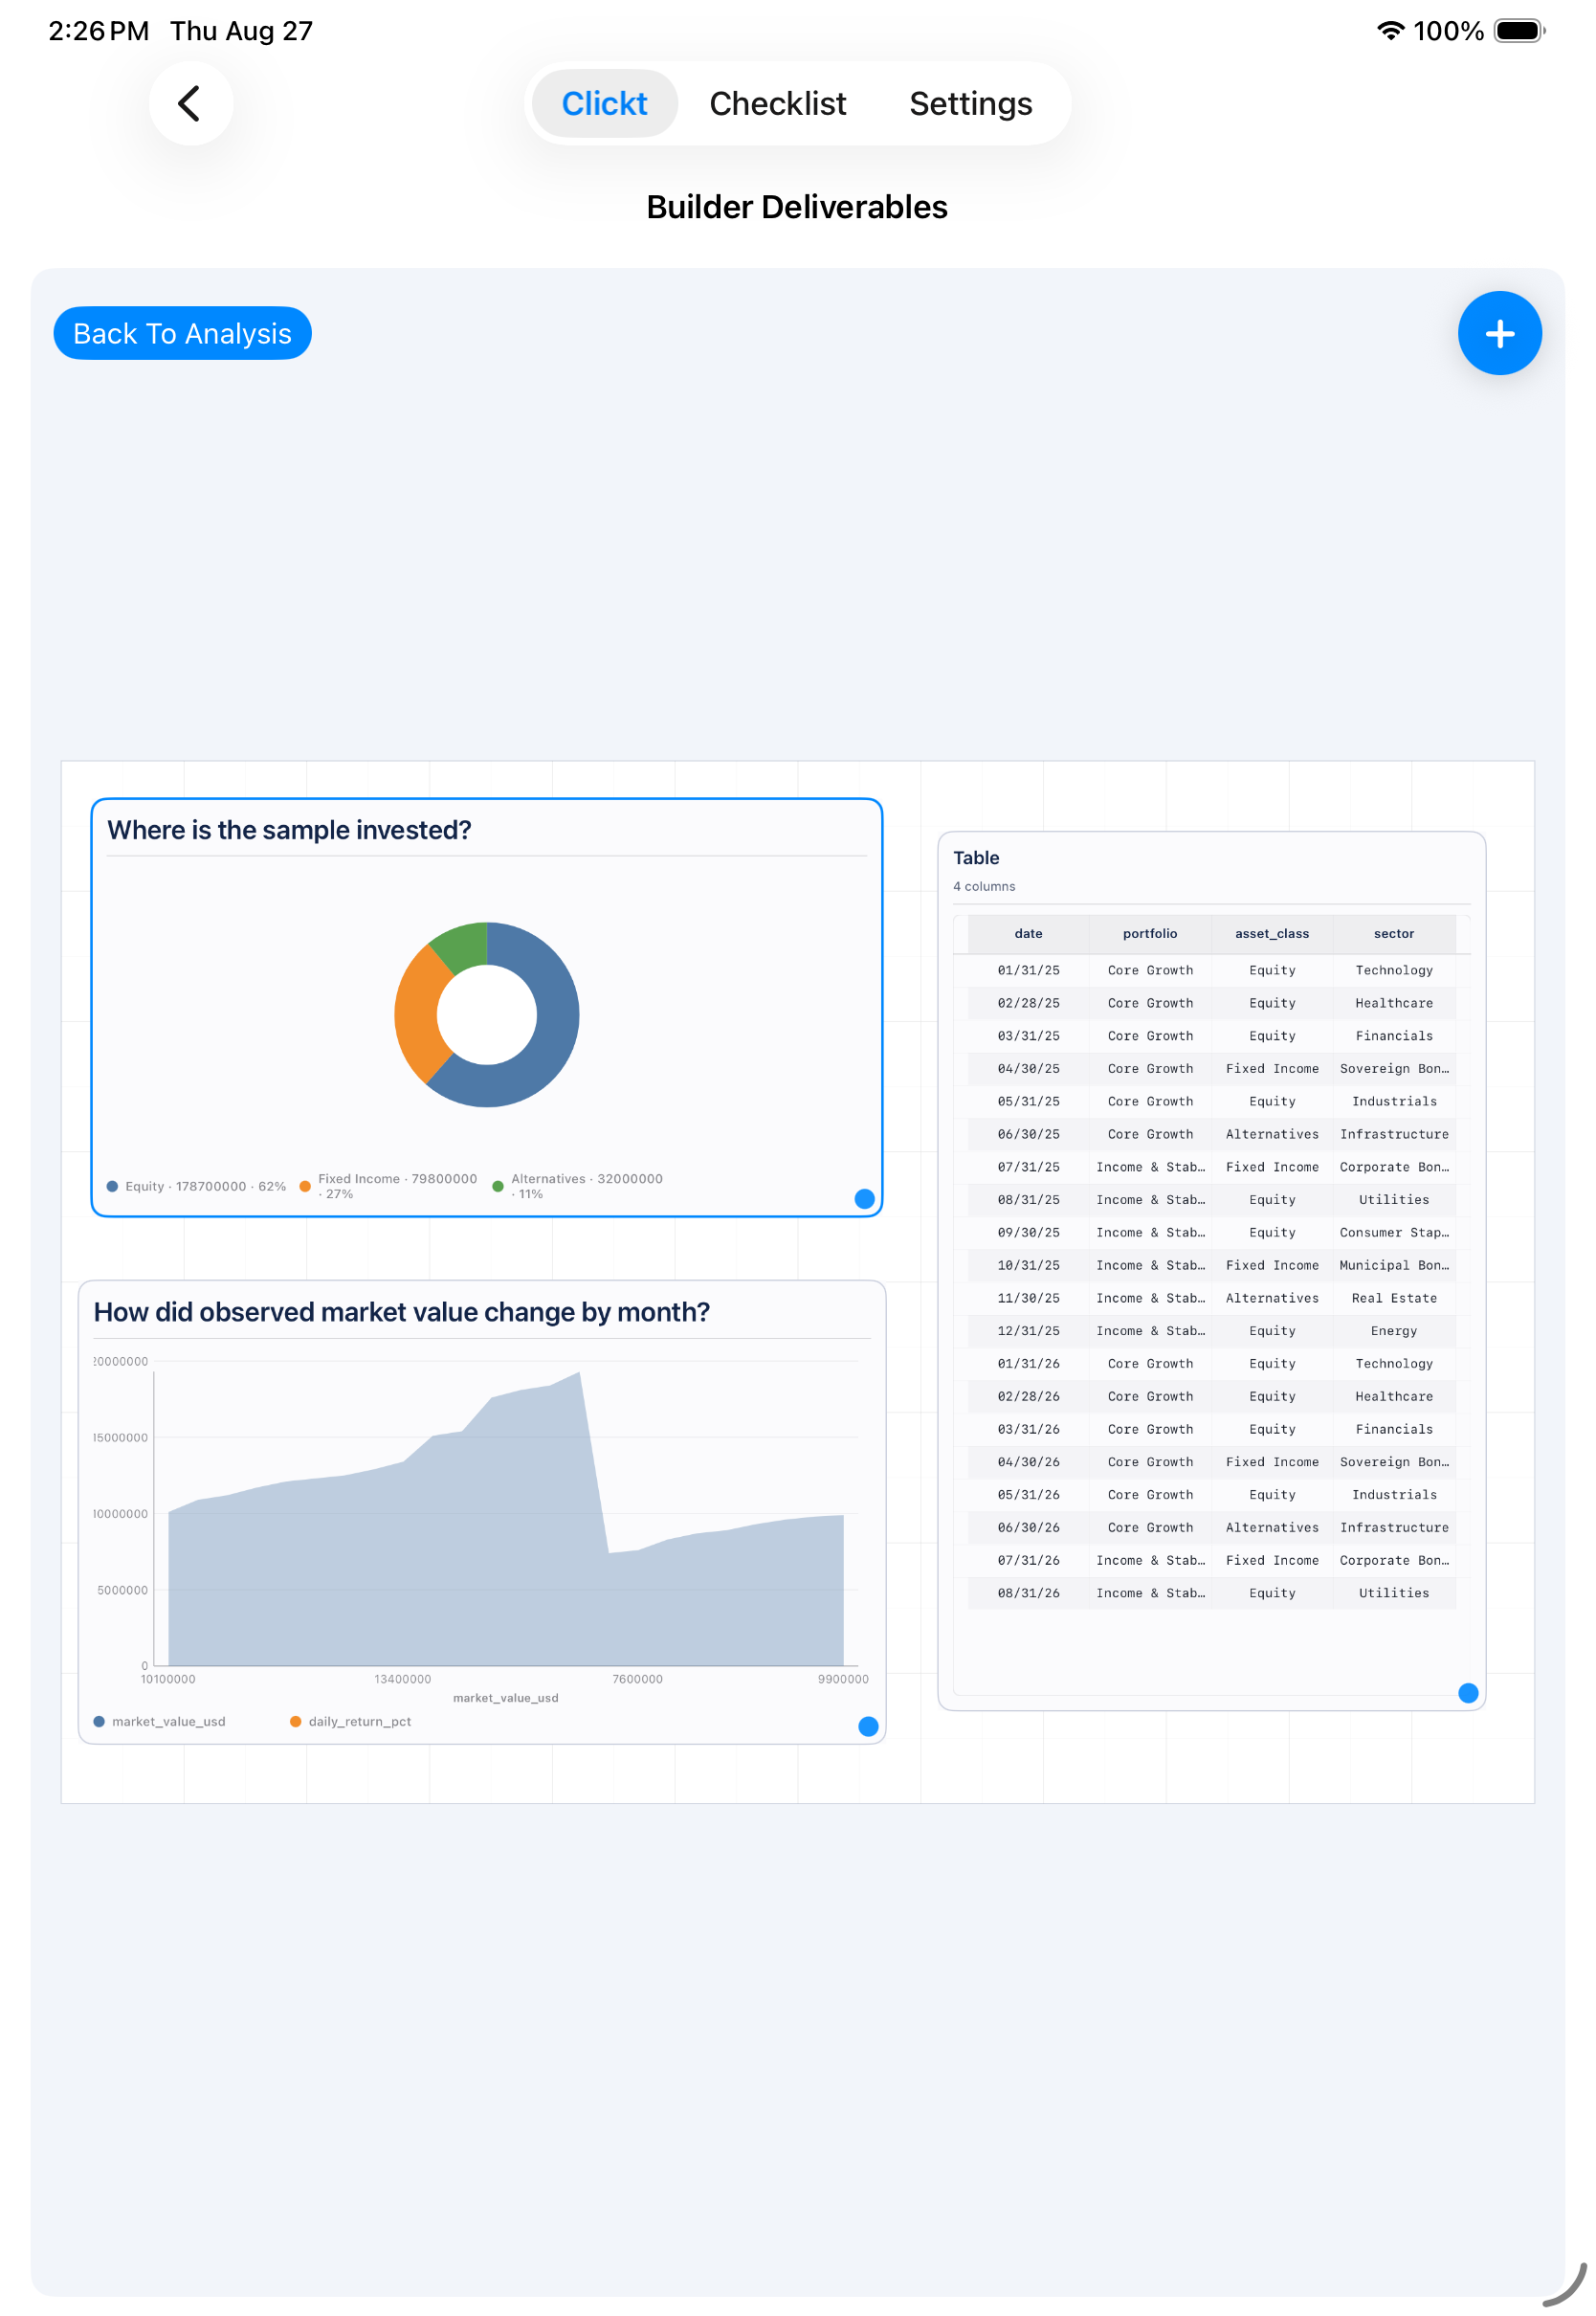
Arrange visual analysis and supporting content into a deliverable that can be reviewed before it is shared.
Builder’s current canvas export options are PNG, DOC, and PPT, and a Builder page can be sent into Presentation.
A familiar Friday afternoon
Sales numbers come in from a handful of different sources as separate exports. Someone spends an hour combining them by hand, building pivot tables, and reformatting charts before they even look right—every single week, from scratch.
Import the same exports, and Builder works through the columns and builds the chart with you on a canvas you can adjust. What used to be an hour of manual spreadsheet work becomes a few minutes of review—and it is ready to hand off to Presentation without rebuilding anything.
The point is not to automate a conclusion. It is to prepare a readable analysis and preserve the judgment needed before it becomes an output.
Import the data you want to work with or create a dataset manually inside Builder.
Select the relevant dataset details and shape the analysis steps or chart treatment around the question.
Arrange the result on the Builder canvas so it can be reviewed as a coherent, readable output.
Export the canvas as PNG, DOC, or PPT, or send it to a new or existing Presentation deck.
ClicktAI in Builder
ClicktAI can help prepare a proposed analysis plan around the selected data. It remains a preview until you review the plan and explicitly choose to apply it.
YouPrepare a weekly view of sales activity by region.
The proposed analysis is not applied until you review and approve it.
Keep the evidence attached
Builder keeps the visual work close to its data context. When the result needs to become an update, it can move into Presentation without rebuilding the canvas manually.
Next: turn the deliverable into a presentation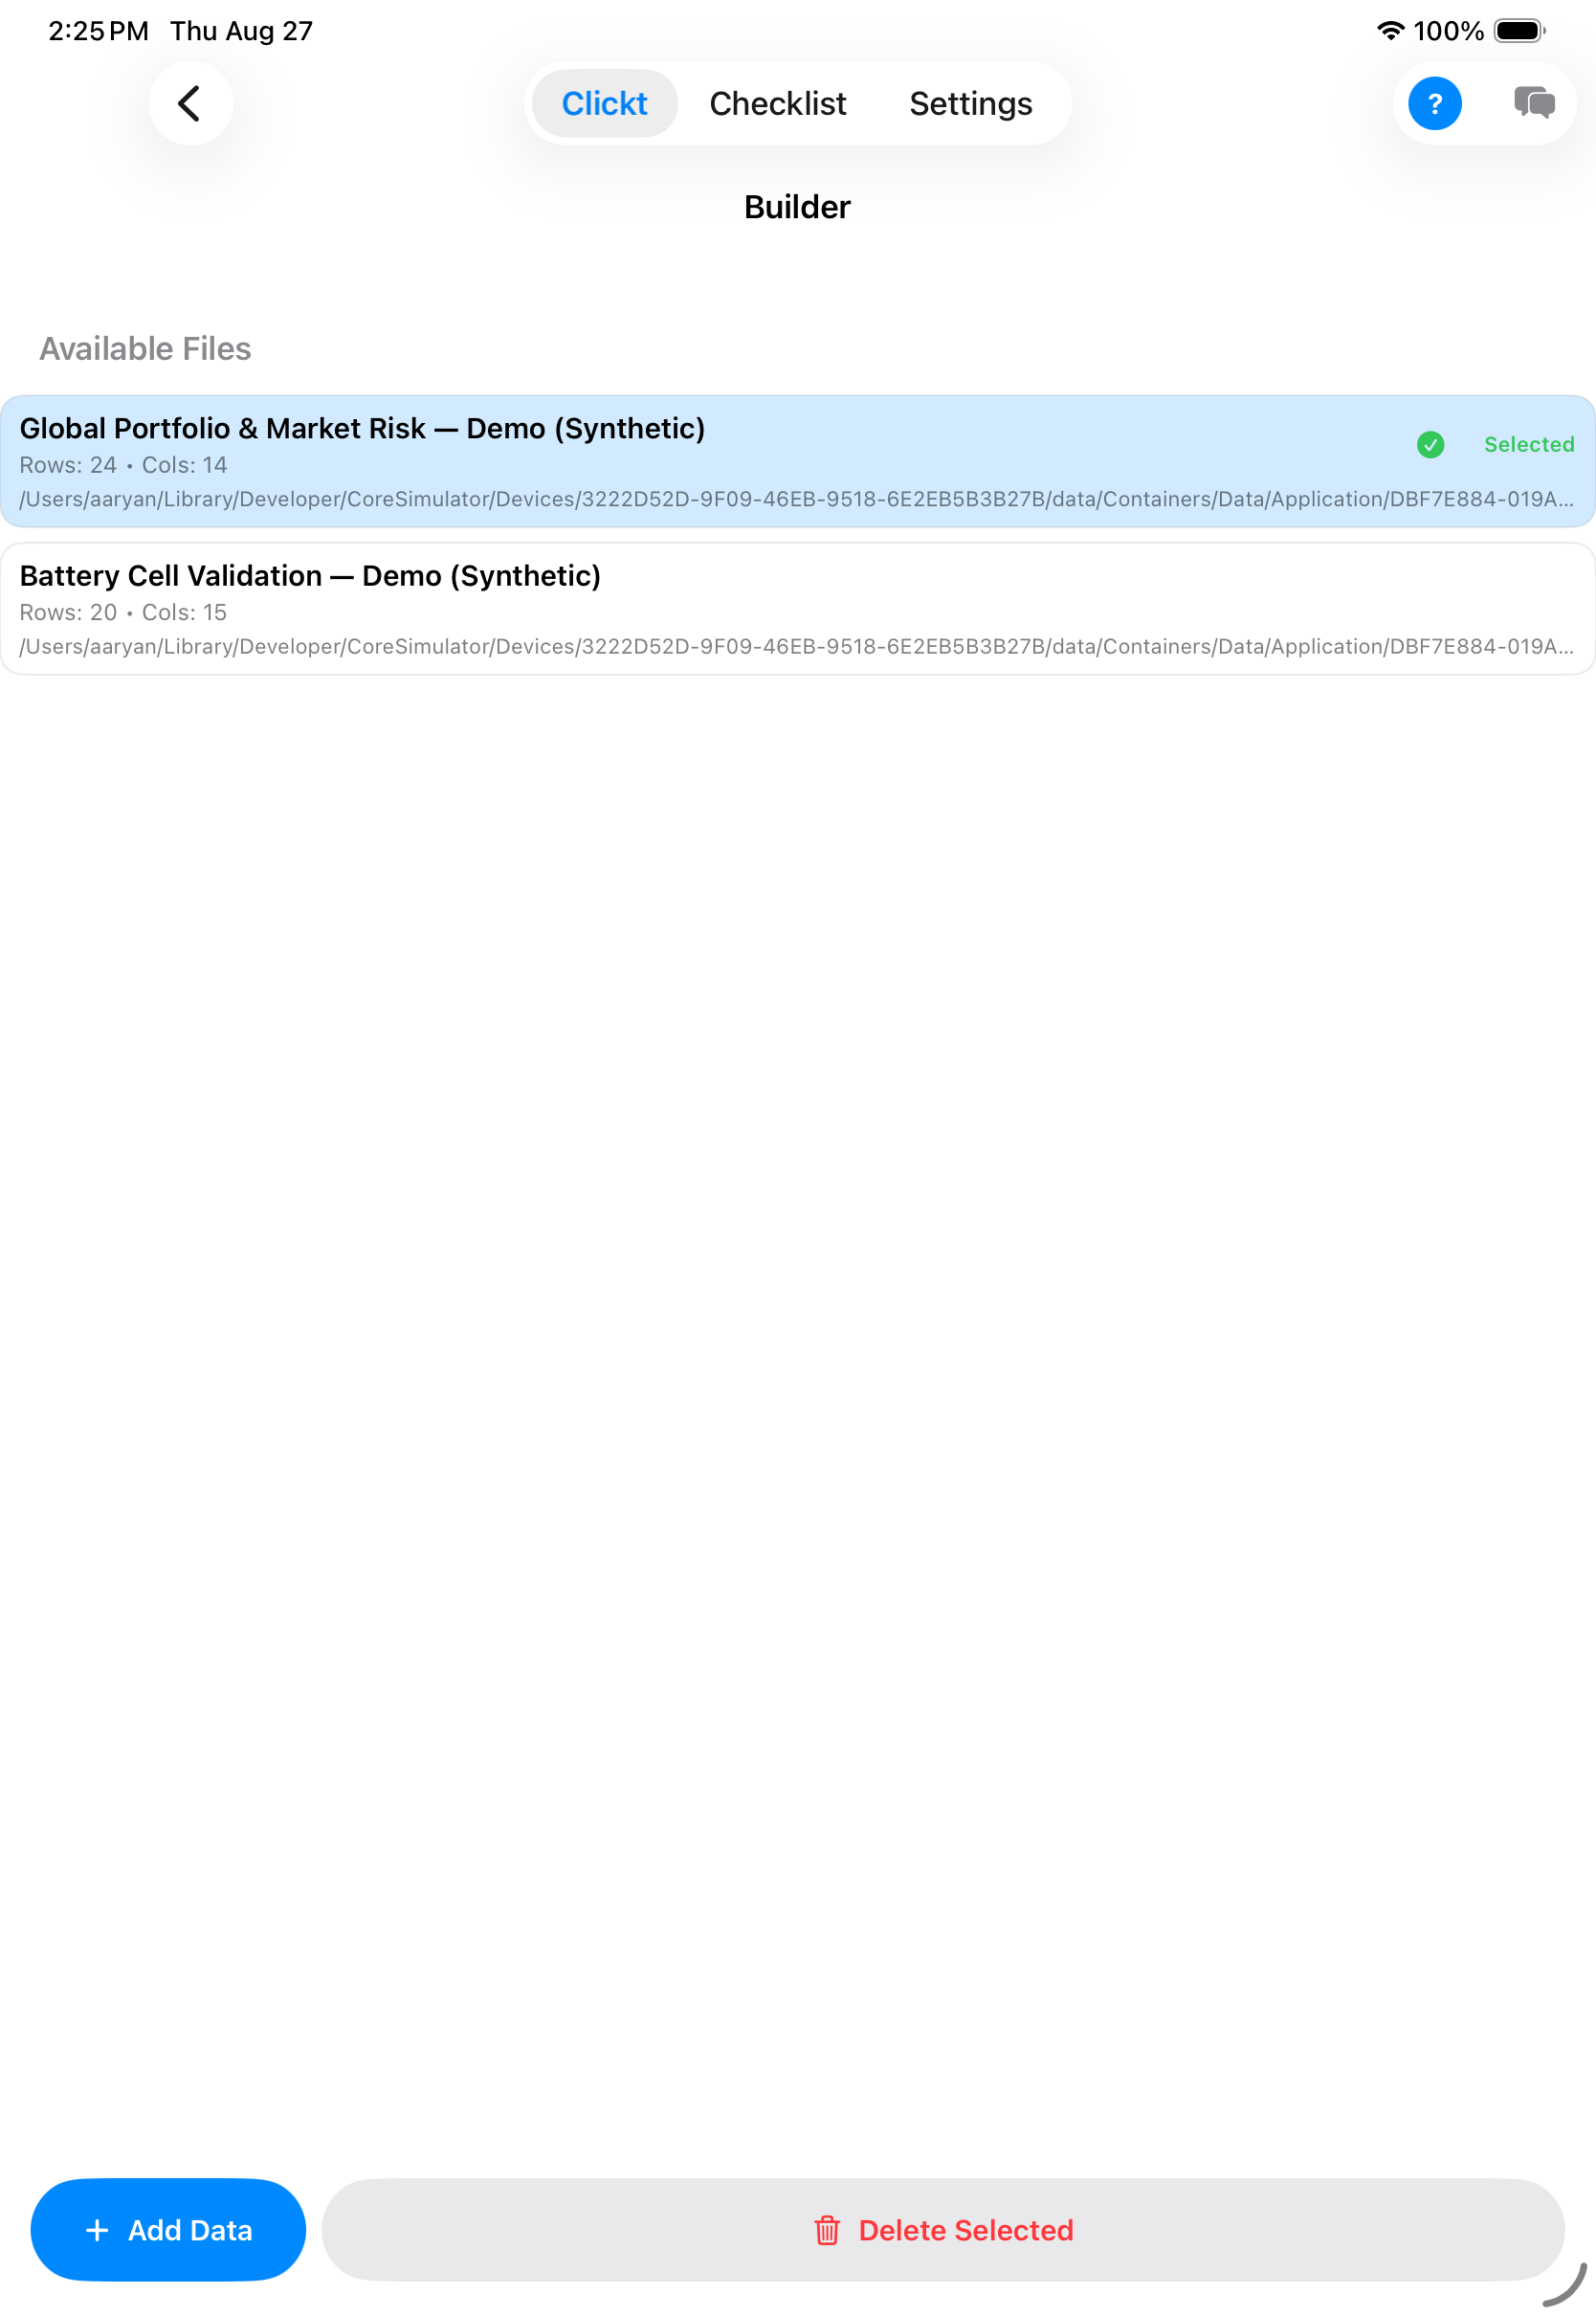
Make the evidence easier to use
Builder is available in Clickt on Apple and Android platforms.